After adding an assessment to a conversation, you can track the assessment analytics. This solution explains how to navigate the analytics page and track learners' scores and the cohort average.
Steps
- In your GenLearn dashboard press assessment at top to open the assessments analytics page
- You can choose to look at the performance criteria (assessed on a pass/fail basis) or at a skills rubric (assessed on learners' capability in different skills).
- To look at performance criteria assessment:
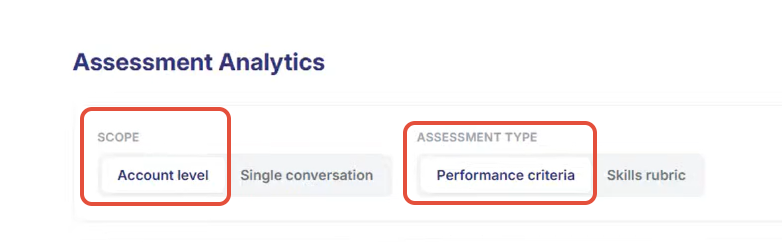
- Select 'Performance criteria' under assessment type
- You can change the scope to account level, which looks at the cohort average
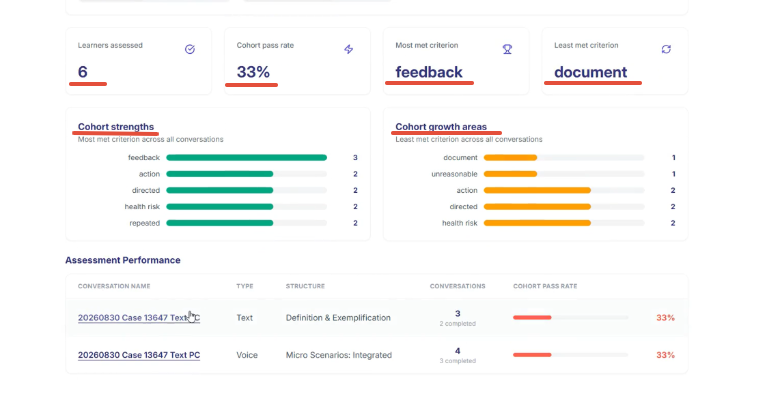
- This shows the following analytics:
- The numbers of learners that have been assessed
- The cohort pass rate (as a percentage)
- The most met criterion
- The least met criterion
- A table of the strengths and areas for growth
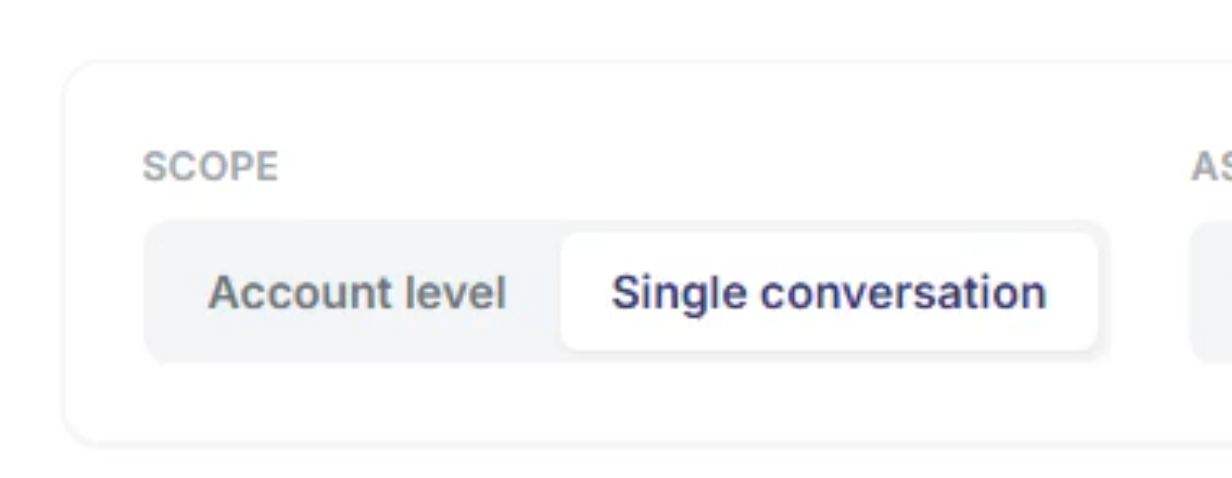
- To see the individual learner data, switch the scope to 'Single conversation'
- You can select different conversations and look at the same data at a single level
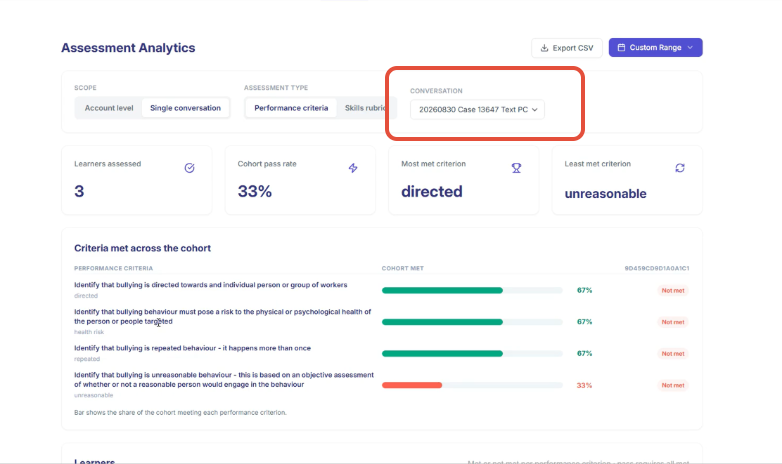
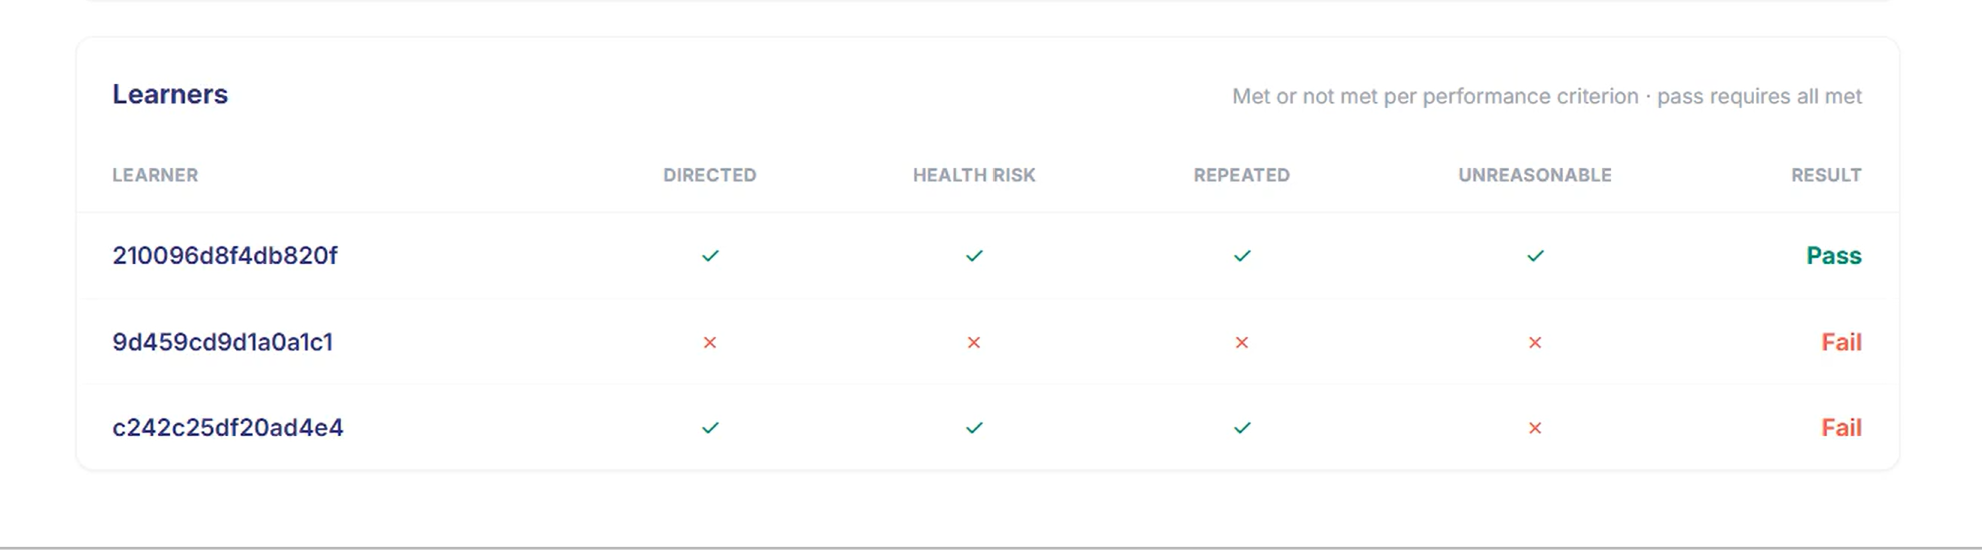
- If you scroll to the bottom, you can see an overall table of each learner and whether they passed or failed. If you press on their ID, you can scroll up and see how they compared to the cohort under 'Criteria met across the cohort'
- To look at skills rubric assessment:
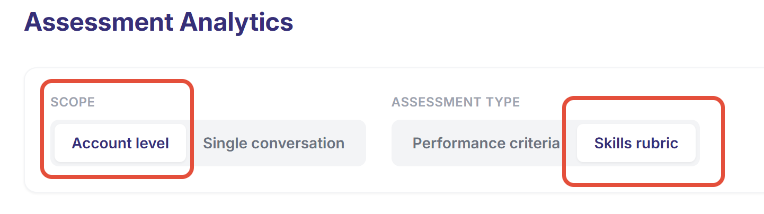
- Select 'Skills rubric' under Assessment type, and 'Account level' under scope
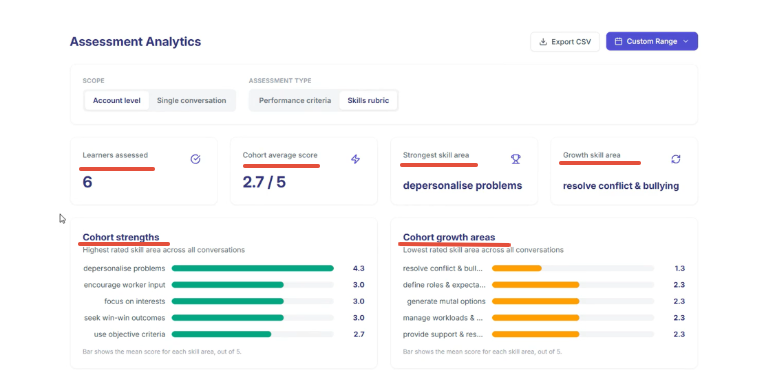
- This shows the following analytics:
- The number of learners assessed
- The cohort average scored out of 5
- The strongest skill area
- The growth skill area
- The strength and grow areas overall
- Switch the scope to 'Single conversation' to see the analytics from an individual learner level
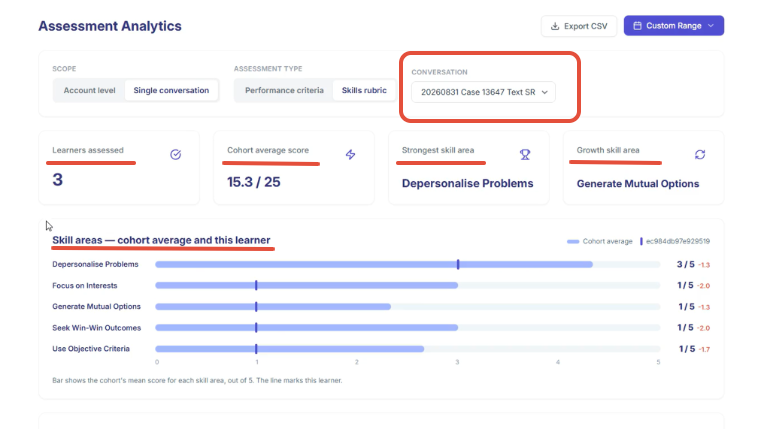 You can scroll down to see individual learners and how they performed in different skill areas. Select the conversation ID to see where the learner ranks compared to the cohort average.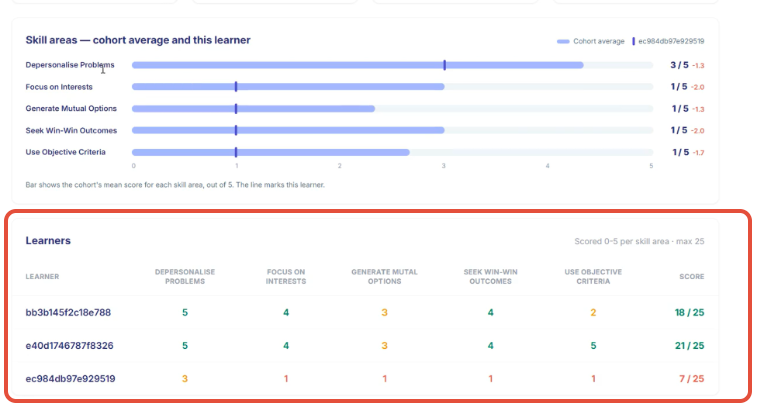
- Select 'Skills rubric' under Assessment type, and 'Account level' under scope
Was this article helpful?
That’s Great!
Thank you for your feedback
Sorry! We couldn't be helpful
Thank you for your feedback
Feedback sent
We appreciate your effort and will try to fix the article